Interactive data exploration
Explore gene-expression matrices, other biological measurements and general feature-and-sample datasets through clustering, projections and linked visualizations.
 resonalis
RESONALIS / EXPLORING WHAT COMES NEXT
Exploratory analysis for biological data and modern machine learning — connecting multivariate statistics, interactive visualization and the emerging capabilities of artificial intelligence.
Rooted in bioinformatics. Expanding into AI. One shared challenge: finding structure in complex data.
01 / OUR VISION
The most valuable patterns are rarely obvious. We believe researchers and engineers need more than automated answers: they need the ability to explore, question and understand their data. MolMine is building toward a workspace where human insight and intelligent computational tools complement one another.
02 / WHY J-EXPRESS RETURNS
When J-Express first emerged, researchers faced thousands of gene-expression measurements and needed ways to discover relationships hidden in high-dimensional data. Clustering, principal component analysis, self-organizing maps and linked visualization helped turn those measurements into explorable patterns.
Biological research still needs these methods, while machine learning and foundation models generate high-dimensional embeddings and learned representations. Across both fields, many fundamental questions converge: Which observations belong together? What separates them? Where are the outliers? Which features explain a pattern?
That is why we are bringing J-Express back — not to leave bioinformatics behind, but to extend the same exploratory methods to a new field. The workspace supports biological feature-and-sample matrices and other compatible high-dimensional numerical datasets. Understanding the mechanisms of AI models will also require new, model-aware methods.

One analytical foundation. From biological measurements to AI representations.
03 / THE APPROACH
Our approach connects biological data analysis and machine-learning exploration through shared methods: interpretable statistics, clustering, projections and interactive inspection.
Explore gene-expression matrices, other biological measurements and general feature-and-sample datasets through clustering, projections and linked visualizations.
Explore model-generated text embeddings using PCA, UMAP, cosine nearest neighbors, semantic search and interactive neighborhood analysis.
We aim to give AI agents access to explicit, reproducible analysis operations — allowing them to suggest hypotheses, run tools and help interpret results.
04 / MODERN RNA-SEQ ANALYSIS
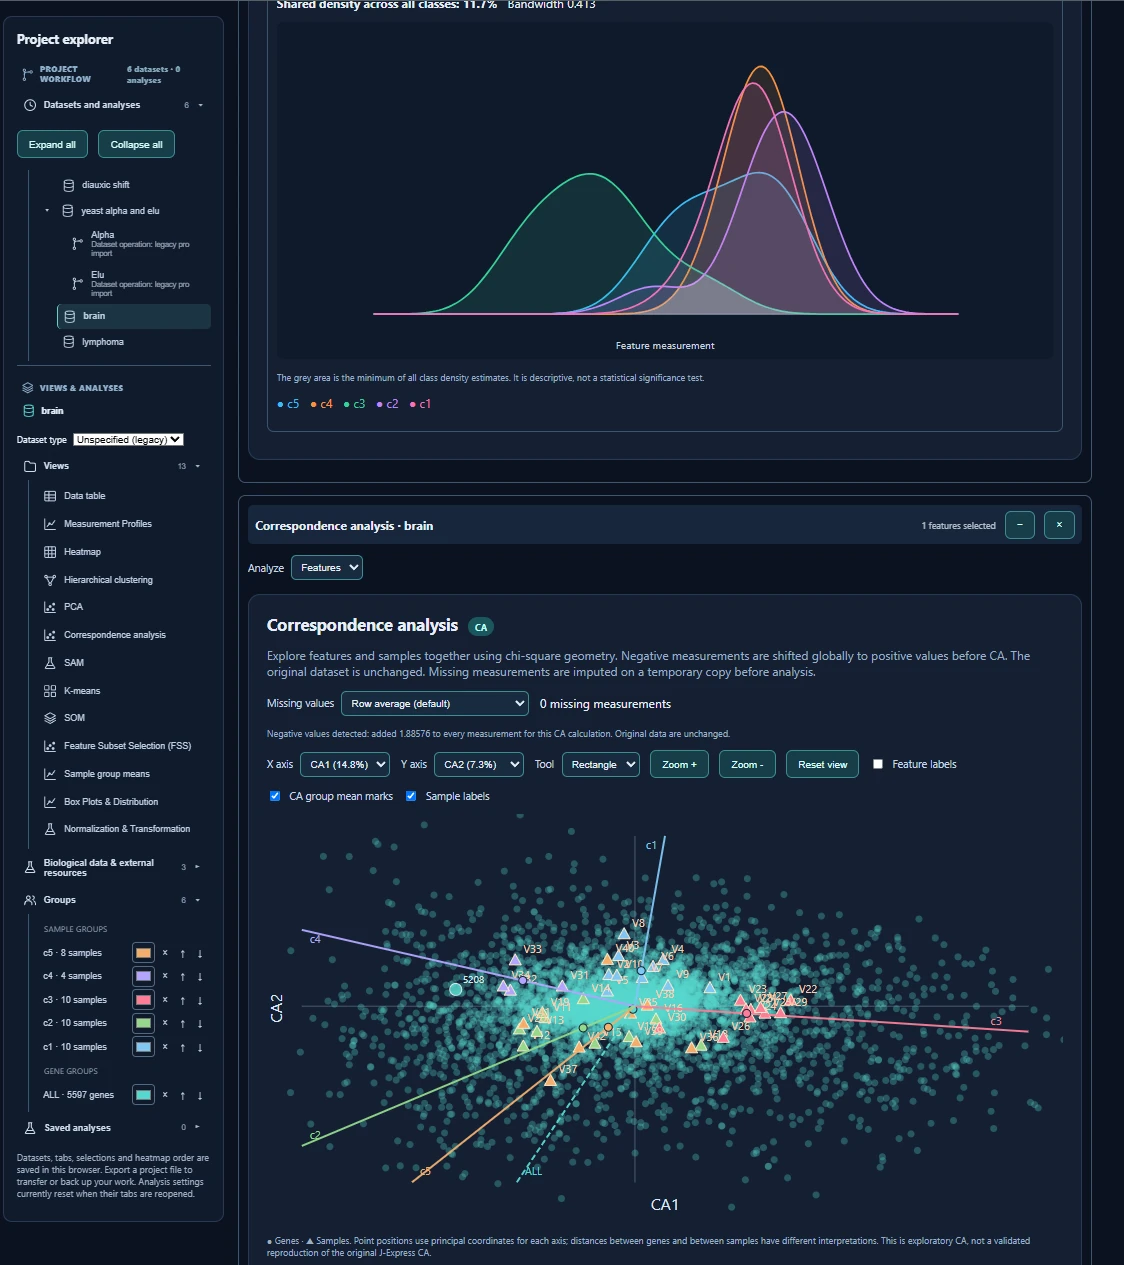
Modern RNA sequencing produces expression measurements for thousands of genes across samples. J-Express helps you explore the resulting gene-by-sample matrix: inspect sample structure with PCA and correspondence analysis, compare expression patterns using heatmaps and hierarchical clustering, investigate individual gene profiles, and use feature selection to identify informative genes.
Import a prepared, appropriately normalized or transformed expression matrix as CSV/TSV, with genes as features and samples as columns. Sample metadata and groups help interpret biological contrasts. J-Express is an interactive downstream exploration environment, not a replacement for read alignment, transcript quantification or RNA-seq-specific count modeling such as DESeq2/edgeR. Do not interpret general-purpose differential-analysis results as validated RNA-seq count statistics.
Open J-Express, choose Demo → Gene expression (export any unsaved project first), then select the demo dataset in Project Explorer. Start with Views → PCA to inspect sample relationships; open Measurement Heatmap or Hierarchical clustering to compare genes and samples; then try Measurement Profiles and Feature Subset Selection (FSS) to inspect or rank expression patterns. Group colors and linked selection help follow the same samples/features between views.
The bundled Gene expression demo comes from a legacy J-Express .pro project; it is not an RNA-seq sequencing/count dataset. It demonstrates the exploration workflow. For a real RNA-seq study, first prepare an appropriate expression matrix with sample annotations in an RNA-seq analysis pipeline.
04 / AI INTERPRETABILITY
AI models are becoming more capable, but understanding what happens inside them remains a major research challenge. Why does a model respond differently to similar inputs? Which internal representations change when unexpected behavior appears?
Resonalis aims to bring the exploratory strengths of J-Express to this problem: analyzing activation patterns, comparing groups of model runs and visualizing high-dimensional representations. These analyses may help researchers identify candidate features and formulate testable hypotheses about model behavior.
Finding correlations is not the same as establishing causes. Explaining why a model behaves a certain way also calls for model-aware experiments and causal intervention methods — directions for future research, rather than capabilities we claim to provide today.
Make the hidden structure of AI models easier to explore.
05 / HOW IT COULD WORK
J-Express already lets researchers inspect multidimensional data through linked visualizations. We are extending these workflows to modern embeddings, while automated AI-agent analysis remains a research direction.
Import biological datasets, existing J-Express projects, numeric CSV/TSV matrices or embedding vectors. J-Express also includes real text-embedding demonstrations and optional browser-local MiniLM inference.
Use clustering, projections and linked visualizations to explore structure, outliers and meaningful differences.
Ask questions, evaluate proposed analyses and examine the evidence behind each finding. Agent-driven workflows are part of our roadmap.
Illustrative future workflow — not a claim that all AI integrations are available today.
06 / THE PLATFORM
J-Express is back as a browser-based data exploration workspace. For biological data it supports PCA, correspondence analysis, hierarchical clustering and heatmaps, self-organizing maps, measurement profiles, feature selection, and differential analysis including SAM where applicable. Legacy J-Express .pro projects can be imported, and projects can be saved locally or exported as JSON.
J-Express also supports embedding datasets, UMAP, cosine nearest neighbors, semantic search, Concept Explorer and neighborhood-preservation analysis. A MiniLM text demo shows how sentences become numerical vectors; compatible new text can be embedded locally in the browser when model assets are available. These techniques help reveal relationships in representations; they do not, by themselves, explain the causal mechanisms of an AI model.
Biological analysis remains central. Direct agent-controlled workflows and broader model integrations are planned rather than available features.
Try J-Express07 / SEE IT IN ACTION
Explore biological data and AI embeddings in the same browser-based J-Express workspace, from clustering and interactive feature analysis to UMAP, semantic search, and exploration of model-generated representations.
J-Express is evolving. Generating new text embeddings can require downloading a model after consent. Neither projection nor semantic similarity establishes causality.